When you’re trying to make good decisions, whether it’s about your product, your customers, or your team, you’ve got two big piles of information staring back at you: numbers and stories. The numbers – that’s your quantitative data. The stories – that’s your qualitative data, like what people say in surveys or how they feel.
Lots of folks get stuck trying to pick just one. They either dive deep into spreadsheets, ignoring what real people are saying, or they get so caught up in heartwarming anecdotes that they miss the big picture the numbers are painting. The truth is, you need both. And not just side-by-side, but actually working together. It’s like trying to build a strong house with just bricks (numbers) or just mortar (stories). You need both to hold it all together.
Understanding the Two Sides of the Coin
Let’s break down what we mean by quantitative and qualitative. It’s helpful to know what each brings to the table before we start mixing them up.
What is Quantitative Data?
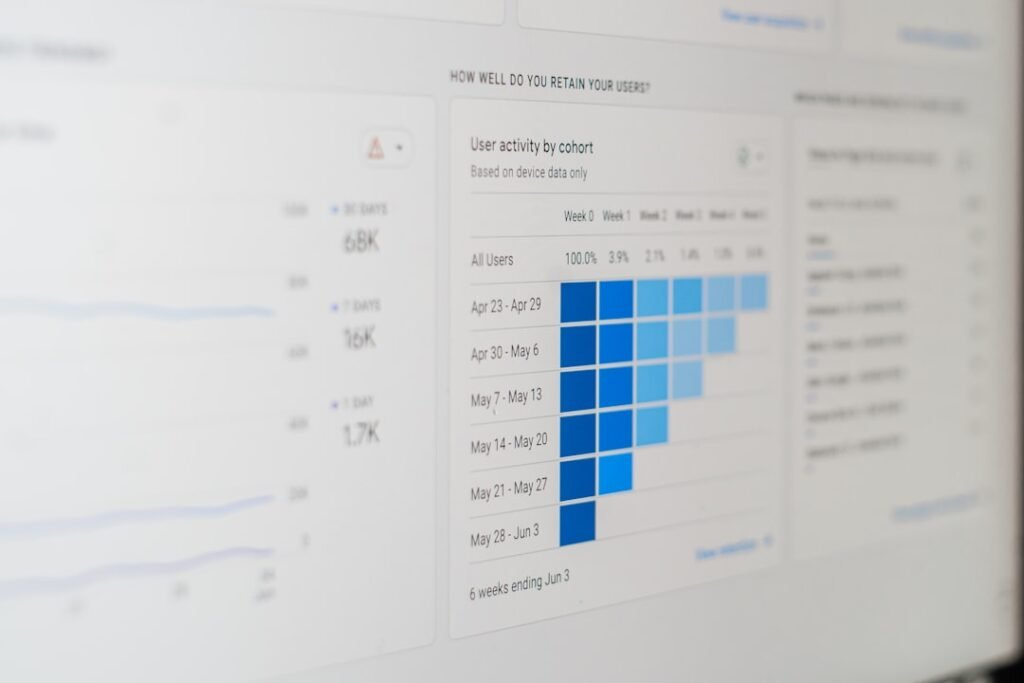
Quantitative data is all about numbers. Think clicks, sales figures, website visits, conversion rates, customer churn rates, average time spent on a page. It’s measurable, usually comes in large volumes, and helps you see patterns and trends. It tells you “what” is happening and “how many.”
- The Power of Scale: With quantitative data, you can look at thousands, even millions, of data points. This helps you understand broad behaviors and trends across a large group.
- Objectivity (Mostly): While how you interpret the numbers can be subjective, the numbers themselves are generally seen as objective facts. A 10% increase is a 10% increase.
- Tracking Performance: This data is fantastic for tracking key performance indicators (KPIs) and seeing if your changes are actually making a numerical difference.
Balancing quantitative data with qualitative insights is crucial for making informed decisions in any organization. A related article that delves into the importance of integrating various data types is a review of “The Master Algorithm,” which explores how different algorithms can be applied to synthesize data effectively. This resource highlights the significance of understanding both numerical metrics and human experiences to create a comprehensive view of customer and employee sentiments. For more insights, you can read the article here: The Master Algorithm Book Review.
What is Qualitative Data?
Qualitative data is about understanding the “why.” It’s customer feedback, employee interviews, open-ended survey responses, usability testing observations, and even social media comments. It’s about feelings, opinions, experiences, and motivations.
- Deep Dives into “Why”: This is where you get to hear directly from people in their own words. You understand their frustrations, their delights, and what really drives their decisions.
- Context and Nuance: Numbers can tell you that a lot of people are leaving your website at a certain point, but qualitative data can tell you why they’re leaving – maybe the navigation is confusing, or the content isn’t what they expected.
- Uncovering Unexpected Insights: Sometimes, people will tell you things you never even thought to measure, opening up new avenues for improvement or innovation.
The Pitfalls of Leaning Too Heavily on One
It’s easy to fall into the trap of only using one type of data. Let’s look at why that’s a problem.
The Danger of Data Overload Without Context
Imagine looking at a spreadsheet full of sales numbers. You see a dip in a particular region. Without qualitative data, you might assume a competitor launched a new product or your marketing campaign failed. But if you talk to your sales team or customers in that region, you might find out there was a major local event that temporarily diverted attention, or a new economic challenge specific to that area. The numbers tell you what happened, but not why it happened or how people are feeling about it.
The Risk of Anecdotal Evidence Guiding Major Decisions
On the flip side, relying solely on qualitative feedback can be just as risky. You hear one customer passionately complain about a feature, and suddenly you’re ready to scrap it. But what if that customer is an outlier? What if 99 other customers love that feature, and the numbers show it’s actually contributing to a significant portion of your revenue? An anecdote, no matter how compelling, isn’t always representative of the larger truth. This is where qualitative data needs to be validated and grounded by the quantitative.
Strategies for Bringing Data and Stories Together
The real magic happens when you stop seeing these two as separate entities and start treating them as partners. They inform and enrich each other.
Balancing quantitative data with qualitative insights is crucial for making informed decisions in any organization. For instance, while metrics can provide a clear picture of performance trends, customer feedback and employee sentiment can offer deeper context that numbers alone might miss. To explore effective strategies for navigating these complexities, you might find it helpful to read this article on tips for saying no as a product manager, which discusses how to prioritize insights and make tough decisions. By integrating both data types, you can enhance your understanding and drive better outcomes. You can check out the article here.
Starting with Quantitative Data to Identify Trends and Problems
Often, the numbers are your first signal. They’re the smoke alarm that tells you something might be wrong, or a green light indicating something is going well.
- Spotting Outliers: Your analytics might show an unusual spike in customer support calls for a specific product. This is a quantitative flag.
- Pinpointing Drop-Off Points: Website analytics can clearly show where users are abandoning a purchase or a sign-up process. This “where” is numerical.
- Measuring Impact: If you launched a new feature, quantitative data tells you how many people are using it and if it’s impacting your desired metrics (like increased engagement or reduced churn).
Once you have these numerical flags, that’s your cue to dig deeper with qualitative methods.
Using Qualitative Insights to Explain the “Why” Behind the Numbers
This is where the stories come in to give meaning to the statistics.
- Interviewing Users After a Drop-Off: If your quantitative data shows a significant drop-off on your checkout page, you might conduct usability tests or interviews with users who abandoned their carts. They can tell you if the process was confusing, if shipping costs were too high, or if they encountered a technical glitch.
- Understanding Support Call Spikes: For that spike in support calls, you’d review call transcripts, listen to recordings, or interview support agents. They might reveal a specific bug, a confusing instruction manual, or a common misunderstanding about the product.
- Gathering Feedback on Feature Adoption: If a new feature isn’t being used as much as expected, surveys or user interviews can uncover why. Is it hard to find? Does it not solve their real problem? Is it buggy?
Validating Qualitative Hypotheses with Quantitative Proof
You’ve heard some compelling stories. Now it’s time to see if these stories are just isolated incidents or if they represent a broader truth.
- Surveying a Wider Audience: If a few customer interviews suggest a common pain point, create a survey to ask a larger group if they experience the same issue. Quantify the prevalence of that pain point.
- A/B Testing Solutions: Based on qualitative feedback, you might hypothesize that changing the wording on a button will increase conversions. You can then A/B test this change to see if it numerically improves your conversion rate.
- Tracking Behavior After Implementations: If your qualitative data pointed to a need for a new resource, once you provide it, track its usage and see if it impacts related KPIs. Did it reduce support tickets for that specific issue? Did it increase feature adoption?
Ensuring a Human-Centered Approach
It’s not just about crunching numbers or collecting quotes. It’s about remembering that behind every data point and every story is a person.
Actively Listening to and Empathizing with Your Audience
This means going beyond just collecting feedback. It means really trying to understand their perspective, their struggles, and their goals. When reviewing qualitative data, try to put yourself in their shoes. What are they really trying to say? How does this impact their day-to-day experience? This empathy will help you interpret both the qualitative and quantitative data more effectively. If you just look at numbers, it’s easy to forget the human impact. If you only hear anecdotes, it’s easy to get lost in individual problems.
Avoiding Bias in Interpretation
Both types of data can be skewed. With quantitative data, you need to be careful about how you collect it (e.g., proper sampling, clear definitions) and how you interpret correlations versus causation. With qualitative data, you need to watch out for confirmation bias – only hearing what you want to hear – and ensuring you’re talking to a diverse group of people, not just the loudest voices. Always ask yourself: “Am I looking for evidence to support my existing belief, or am I truly open to what the data is telling me?”
Making Decisions with Confidence
When you integrate both quantitative and qualitative data, you’re not just guessing; you’re making informed decisions.
Creating a Clear Narrative That Combines Both
Imagine you’re presenting to stakeholders. Instead of saying, “Our conversion rate dropped by 5% last quarter,” you can say, “Our conversion rate dropped by 5% last quarter, and our interviews revealed that many users found the new sign-up flow confusing because it asked for too much personal information upfront. They felt it was intrusive and unnecessary for the initial step.” This narrative is much more powerful. It’s not just a number; it’s a problem with a human face and a potential solution.
Prioritizing Actions Based on Holistic Understanding
With a combined view, you can better prioritize what to work on. Is that bug impacting 1% of users, but causing immense frustration (qualitative) and leading to high churn for that group (quantitative)? Or is it a minor inconvenience for 50% of users, but they quickly move past it without a significant impact on your metrics? This balanced perspective helps you allocate resources wisely. You can see both the scale of the problem and the depth of its impact.
Building a Culture of Continuous Learning
This isn’t a one-time project. It’s an ongoing cycle of listening, measuring, learning, and adapting.
Iterating and Refining Based on New Information
Every change you make, every experiment you run, should generate new data – both quantitative (did the numbers move?) and qualitative (what are people saying about the change?). This creates a feedback loop that helps you constantly improve. The goal isn’t to be perfect, but to be constantly getting better, and that means always being open to new information from both numbers and stories.
Fostering Cross-Functional Collaboration
Encourage your data analysts to talk to customer support teams. Have your product managers sit in on sales calls. Get your engineers to review user feedback sessions. When different teams see how their work impacts the numbers and the people, it creates a more holistic understanding and a stronger sense of shared purpose. Everyone benefits from understanding both the “what” and the “why.”
Balancing quantitative data with qualitative insights isn’t about picking a favorite. It’s about recognizing that each has unique strengths and that when woven together, they paint a much richer, more accurate, and more actionable picture. It’s about moving beyond just knowing what is happening to truly understanding why it’s happening, and that’s how you build better products, happier customers, and a more successful business. It’s how you make decisions that are both smart and genuinely human.
FAQs
What is the difference between quantitative data and qualitative insights?
Quantitative data refers to numerical information that can be measured and analyzed statistically, while qualitative insights are non-numerical data that provide context, depth, and understanding to the quantitative data.
Why is it important to balance quantitative data with qualitative insights?
Balancing quantitative data with qualitative insights allows for a more comprehensive understanding of a situation or problem. Quantitative data provides the “what” and “how much,” while qualitative insights provide the “why” and “how.”
How can quantitative data and qualitative insights be balanced effectively?
Quantitative data and qualitative insights can be balanced effectively by using a mixed-methods approach, where both types of data are collected and analyzed in a complementary manner. This can involve using surveys, interviews, and observational data to gather both quantitative and qualitative information.
What are some examples of balancing quantitative data with qualitative insights?
An example of balancing quantitative data with qualitative insights is using customer satisfaction scores (quantitative) alongside customer feedback and comments (qualitative) to understand the reasons behind the scores and identify areas for improvement.
What are the benefits of balancing quantitative data with qualitative insights?
The benefits of balancing quantitative data with qualitative insights include gaining a more holistic understanding of a situation, identifying patterns and trends, validating findings, and making more informed decisions based on a combination of numerical data and contextual understanding.