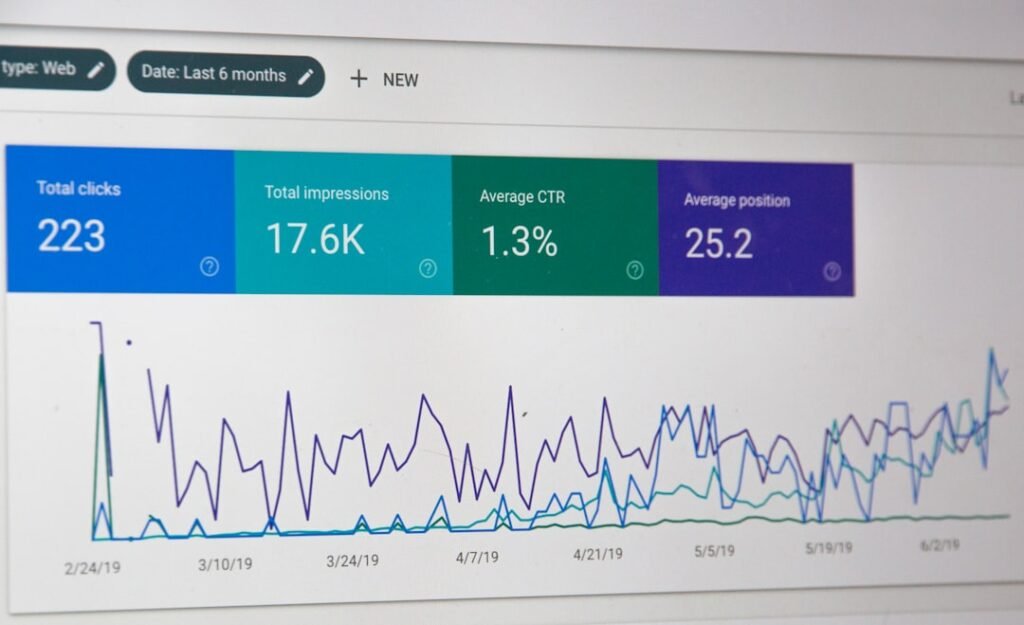
You’ve got a problem. Two different sets of data, both supposed to describe the same thing, are saying completely opposite things. One tells you sales are booming, the other says they’re plummeting. One shows customer satisfaction is through the roof, the other says everyone’s furious. This isn’t just confusing; it’s a roadblock. How do you move forward when your foundational information is at war with itself?
Step 1: Don’t Panic – Assess the Initial Contradiction
Your first instinct might be to assume one is right and one is wrong. Resist that urge. Both pieces of data exist for a reason. Instead, take a deep breath and acknowledge the conflict.
Acknowledge the Discrepancy, Don’t Dismiss It
It’s easy to pick the data that confirms your existing beliefs or the one that’s easier to explain. Don’t. The conflict itself is a signal. It tells you there’s something important you don’t understand yet. Jot down what each data source is claiming, side-by-side, to visually highlight the chasm.
Avoid Instant Blame or Assumptions
Don’t immediately point fingers at a specific team or data source. This isn’t about finding fault; it’s about finding truth. Jumping to conclusions can close off avenues of investigation before you even begin. Maybe it’s a simple misunderstanding, not a conspiracy.
When faced with conflicting narratives from two data sources regarding a problem, it is crucial to approach the situation methodically. One effective strategy is to delve into the underlying assumptions and methodologies of each data source to identify potential biases or discrepancies. Additionally, consulting related literature can provide valuable insights into best practices for data analysis and interpretation. For instance, the book “Hooked: How to Build Habit-Forming Products” offers a comprehensive look at behavioral patterns that can influence data interpretation. You can explore this resource further by visiting this link.
Step 2: Dig into the “Who, What, When, Where, Why, and How” of Each Data Source
This is where you become a detective. You need to understand the origin story of each data set.
Who Collected the Data?
Understanding the source is crucial. Was it an internal team? An external vendor? A specific department? Each source might have biases, expertise, or blind spots inherent in their role or tools. A sales team’s internal CRM might prioritize different metrics than the finance department’s revenue reports.
What Exactly Is Being Measured?
This is often the root of the problem. What one data source calls “customer acquisition” another might define as “new sign-ups,” which may or may not translate to paying customers. Be incredibly precise about the definitions. Are you looking at gross revenue or net? Completed tasks or tasks initiated?
When Was the Data Collected?
Timing is everything. One data set might be real-time, while another is aggregated weekly or monthly. A snapshot from yesterday can look very different from a report summarizing the entire last quarter. Check for time zone differences, reporting periods, and any potential lags in data processing.
Where Was the Data Collected?
Is one source global and the other specific to a single region? Are you comparing website analytics from one specific landing page to overall site traffic? Location, in a broad sense, can significantly impact the story the data tells.
How Was the Data Collected?
The methodology matters immensely. Was it a survey? If so, what were the questions? How was the sample selected? Was it automated tracking? If so, what tools were used and how are they configured? Manual data entry is prone to human error, while automated systems can have integration issues or faulty logic.
Why Was the Data Collected?
Understanding the original purpose behind each data collection effort can reveal hidden agendas or limitations. Data collected for a marketing campaign might emphasize engagement, while data collected for an internal audit will focus on compliance and accuracy. Each purpose shapes the data’s focus and potential biases.
Step 3: Look for the Gaps, Overlaps, and Divergent Definitions
Once you have a detailed understanding of each source, you can start to pinpoint where things went wrong.
Identify Discrepancies in Definitions
This is often the low-hanging fruit. If one report defines a “new customer” as someone who signs up for a free trial, and another defines it as someone who makes their first purchase, you’ve found a major reason for the conflict. Standardize definitions where possible.
Uncover Different Granularities or Aggregation Levels
One data source might show daily sales, while another presents monthly totals. If the daily sales had a massive dip mid-month but the monthly report averages it out, the stories will naturally conflict. Look at the level of detail each source provides.
Check for Data Transformation or Processing Steps
Has one data set undergone more cleaning, filtering, or calculations than the other? A raw data export will look different from a processed report that has had outliers removed or specific categories excluded. Understand the journey the data takes from its origin to your report.
Explore Potential System or Integration Issues
Sometimes the data itself is fine, but the way it’s being pulled or combined creates the problem. Are two systems failing to communicate correctly? Is a data pipeline broken? Are there duplicates being created or records being missed during transfer?
Step 4: Perform Targeted Validation and Cross-Referencing
Now that you have hypotheses about the sources of conflict, it’s time to test them.
Sample and Manually Verify Key Data Points
Pick a small, representative sample of data points where the conflict is most apparent. Go back to the raw source data for both conflicting reports and manually verify these specific instances. Did customer A actually make that purchase? Did the website traffic spike at that exact time? This can be tedious but is often incredibly revealing.
Create a “Golden Source” for a Subset of Data
If you have a clear, reliable source for some information (e.g., your financial system for actual revenue), use that as a benchmark. Compare a smaller slice of data from your conflicting sources against this undeniable truth. This helps to validate one source over another for specific metrics.
Consult Subject Matter Experts
Don’t be afraid to talk to the people closest to the data. The sales manager might know about a recent pricing change not reflected in older reports. The IT team might be aware of a system upgrade that temporarily affected data collection. These experts can provide context that the raw numbers alone cannot.
Run a Parallel Data Collection (If Feasible)
In some critical cases, you might need to set up a new, independent data collection method for a short period, specifically designed to answer the conflicting questions. This can be costly and time-consuming, but for mission-critical decisions, it might be necessary to establish a clear, third-party baseline.
When faced with conflicting narratives from two data sources regarding a problem, it is essential to approach the situation with a critical mindset and a systematic analysis. One effective strategy is to identify the underlying assumptions and methodologies used in each data source, which can often reveal biases or gaps in the information presented. For further insights on navigating such complexities in data analysis, you may find the article on data interpretation techniques helpful, which can be accessed through this link. By employing a structured approach to evaluate the credibility and relevance of each source, you can work towards reconciling the differences and arriving at a more informed conclusion.
Step 5: Synthesize, Communicate, and Resolve
Once you’ve done your detective work, it’s time to bring it all together and make sense of it.
Document Your Findings Thoroughly
Create a clear, concise report detailing your investigation. What were the initial conflicting claims? What steps did you take? What discrepancies did you find in definitions, methodologies, or timing? What was the root cause of the conflict? This documentation is vital for preventing similar issues in the future.
Explain the “Why” Behind the Conflict
Don’t just state that the data was wrong. Explain why it was wrong or why it appeared contradictory. “Report A showed a decrease because it only included US sales, while Report B showed an increase because it included a new, booming international market.” This clarity builds trust and understanding.
Recommend and Implement Solutions
Based on your findings, propose concrete steps to fix the underlying issues. This could involve:
- Standardizing definitions: Create a data dictionary.
- Improving data pipelines: Fix integration issues.
- Adjusting reporting frequencies: Ensure consistent timeframes.
- Training users: Address manual entry errors.
- Retiring unreliable data sources: If one source is consistently inaccurate.
Communicate Transparently to Stakeholders
Share your findings and proposed solutions with everyone affected by the conflicting data. This includes leadership, data users, and data providers. Transparency builds confidence and ensures everyone is on the same page moving forward. It also reinforces the importance of data integrity.
Establish a Monitoring Process
Once you’ve implemented solutions, don’t just walk away. Put a system in place to monitor the corrected data and ensure the conflict doesn’t resurface. Regular data quality checks, automated alerts, or periodic reviews can help maintain data integrity over time. This continuous effort is key to building a reliable data ecosystem.
Dealing with conflicting data is never easy, but by taking a structured, investigative approach, you can move from confusion to clarity. It’s about understanding the nuances, asking the right questions, and ultimately, building a more reliable foundation for your decisions.
FAQs
1. What should you do when two data sources provide conflicting information about a problem?
When faced with conflicting data sources, it is important to first verify the accuracy and reliability of each source. This may involve checking for errors in data collection or analysis, as well as assessing the credibility of the sources themselves.
2. How can you reconcile conflicting data from two sources?
One approach to reconciling conflicting data is to look for commonalities and differences between the sources. This may involve conducting further research or analysis to identify potential reasons for the discrepancies and to determine which source is more reliable.
3. What steps can be taken to resolve conflicting data issues?
To resolve conflicting data issues, it is important to communicate with the individuals or teams responsible for collecting and analyzing the data. Collaboration and open dialogue can help to identify potential errors or biases and work towards a resolution.
4. How can data quality be improved to prevent conflicting stories?
Improving data quality involves implementing rigorous data collection and validation processes, as well as ensuring that data analysis methods are transparent and well-documented. Regular quality checks and audits can also help to identify and address potential issues.
5. What are the potential consequences of not addressing conflicting data sources?
Failing to address conflicting data sources can lead to inaccurate decision-making and potentially costly mistakes. It can also undermine trust in the data and the individuals or teams responsible for providing it, which can have long-term implications for the organization.