
We understand the critical role sales operations play in the success of any commercial enterprise. Our collective experience has shown us that the effective application of data analytics is not merely an advantage but a cornerstone for optimizing sales team performance. This article outlines our approach to leveraging data in sales operations, providing a structured overview of methods and practical applications. We will explore how a disciplined, data-driven perspective can illuminate pathways to enhanced efficiency and effectiveness within your sales organization.
Before we can effectively utilize data, we must first establish a comprehensive understanding of what constitutes “sales data” within our operational framework. This involves recognizing the various sources, types, and inherent characteristics of the information we collect. Imagine data as the raw material; without proper processing and categorization, it remains inert.
Identifying Key Data Sources
Our journey begins by pinpointing the origins of our sales data. This often encompasses a diverse ecosystem of platforms and systems.
- Customer Relationship Management (CRM) Systems: These are the central repositories for customer interactions, lead statuses, opportunity stages, and sales activities. Data from CRMs provides a chronological narrative of our customer engagements.
- Enterprise Resource Planning (ERP) Systems: ERPs offer insights into order fulfillment, inventory levels, pricing, and revenue recognition. This financial and logistical data complements the customer-centric view from CRMs.
- Marketing Automation Platforms: These systems track lead generation, campaign performance, and initial customer touchpoints, offering a pre-sales perspective that feeds into our sales pipeline.
- Sales Enablement Tools: Data from these tools can reveal content usage, training effectiveness, and the impact of sales collateral on deal progression.
- Communication Platforms: Emails, call logs, and video conferencing transcripts, when analyzed, can yield qualitative as well as quantitative insights into sales interactions.
- External Data Sources: Market research, competitor analysis, and economic indicators provide crucial contextual information that can influence sales strategy.
Defining Key Performance Indicators (KPIs)
Once we have identified our data sources, our next step is to distill this vast ocean of information into actionable metrics, or Key Performance Indicators (KIPs). These are the compass readings that guide our sales efforts.
- Activity-Based KPIs: These measure the volume and frequency of sales activities, such as calls made, emails sent, meetings booked, and demos conducted. They serve as a proxy for effort.
- Pipeline Health KPIs: Metrics like sales cycle length, conversion rates at each stage, deal velocity, and pipeline coverage provide a snapshot of the health and efficiency of our sales funnel.
- Revenue-Based KPIs: These include average deal size, win rate, revenue per salesperson, and customer lifetime value (CLTV). These are the ultimate indicators of financial success.
- Customer-Centric KPIs: Customer satisfaction scores (CSAT), Net Promoter Scores (NPS), and churn rates offer insights into customer retention and loyalty, which are indirectly linked to sales performance.
- Sales Rep Performance KPIs: Individual metrics such as quota attainment, activity metrics per rep, and training completion rates allow us to assess individual contributions and areas for development.
Data Quality and Hygiene
The integrity of our analytical outputs is directly proportional to the quality of our input data. We consider data hygiene not as a chore, but as a continuous strategic imperative.
- Data Accuracy: Ensuring that the information recorded is factually correct. Inaccurate data is a critical flaw, akin to a faulty blueprint.
- Data Completeness: Verifying that all necessary fields are populated and that no critical information is missing. Incomplete data leaves gaps in our understanding.
- Data Consistency: Maintaining uniformity in data entry conventions across all systems and users. Inconsistent data can lead to skewed analyses.
- Data Timeliness: Ensuring that data is collected and updated in a timely manner, reflecting the current state of affairs. Stale data offers a distorted view of reality.
- Data Duplication: Implementing processes to identify and merge duplicate records. Duplicates inflate metrics and complicate analysis.
For those interested in enhancing their sales team performance through data analytics, a related article that delves deeper into effective strategies can be found at this link: Shilotri Newsletter. This resource provides valuable insights and practical tips that complement the techniques discussed in “How to Use Data Analytics to Improve Sales Team Performance – Sales Operations,” helping sales professionals leverage data to drive better results.
Analytical Techniques for Sales Operations
With a solid data foundation in place, we move to the application of analytical techniques. These methods allow us to transform raw data into discernible patterns, trends, and actionable insights. This is where the true value of data analytics in sales operations becomes apparent, moving us beyond simple reporting to predictive and prescriptive capabilities.
Descriptive Analytics: What Happened?
Descriptive analytics provides a historical perspective, summarizing past events. It’s the starting point for any analytical endeavor, allowing us to understand the current state of our sales landscape.
- Reporting and Dashboards: We utilize interactive dashboards to visualize key metrics over time. This includes sales performance against targets, pipeline stage movements, and win/loss analyses.
- Trend Analysis: By examining historical data, we identify upward or downward trajectories in sales performance, conversion rates, or customer acquisition costs.
- Segmentation: We segment our customer base, sales territories, or product lines to understand performance variations across different groups. This helps us pinpoint areas of strength and weakness.
- Root Cause Analysis: When a deviation from expected performance is observed, we use descriptive analytics to trace back the series of events that led to the outcome, identifying potential causal factors.
Diagnostic Analytics: Why Did It Happen?
Diagnostic analytics delves deeper than descriptive by seeking to explain why certain outcomes occurred. It’s like a forensic investigation, uncovering the reasons behind observed patterns.
- Drill-Down Capabilities: We explore specific data points within reports to uncover underlying details. For example, if a territory’s sales are down, we might drill down to specific accounts or sales representatives within that territory.
- Correlation Analysis: We look for relationships between different variables. For instance, is there a correlation between the number of demos conducted and the win rate?
- Comparative Analysis: We compare performance across different periods, sales teams, or marketing campaigns to identify contributing factors.
- Pattern Recognition: We apply algorithms to identify recurring patterns in sales behavior or customer responses, which can indicate underlying causes.
Predictive Analytics: What Will Happen?
Predictive analytics utilizes historical data to forecast future outcomes. This is where we begin to anticipate future sales performance and market trends, allowing for proactive strategic adjustments.
- Sales Forecasting: We employ statistical models (e.g., time series analysis, regression) to forecast future sales revenue, lead volume, and customer acquisition.
- Lead Scoring and Prioritization: By analyzing past conversion rates and lead characteristics, we can develop models to score new leads, enabling sales teams to prioritize their efforts on those most likely to convert.
- Churn Prediction: We build models to identify customers at risk of churning, allowing us to implement proactive retention strategies.
- Opportunity Sizing and Likelihood: Predictive models can estimate the potential value of open opportunities and the probability of closing them, aiding in pipeline management.
Prescriptive Analytics: What Should We Do?
Prescriptive analytics takes us a step further by not only predicting outcomes but also recommending specific actions to achieve desired results. This is the pinnacle of data-driven decision-making, offering actionable guidance.
- Recommended Next Best Actions: Based on customer profiles and past interactions, we can suggest specific sales activities or content for representatives to engage with prospects.
- Optimized Resource Allocation: Prescriptive models can advise on the optimal allocation of sales representatives to territories or customer segments based on potential and performance metrics.
- Dynamic Pricing Strategies: We can use data to recommend adjustable pricing based on market demand, competitor pricing, and customer segmentation.
- Sales Coaching and Training Recommendations: By analyzing individual sales representative performance data, we can identify specific skill gaps and recommend targeted training modules.
Optimizing Sales Processes and Workflows
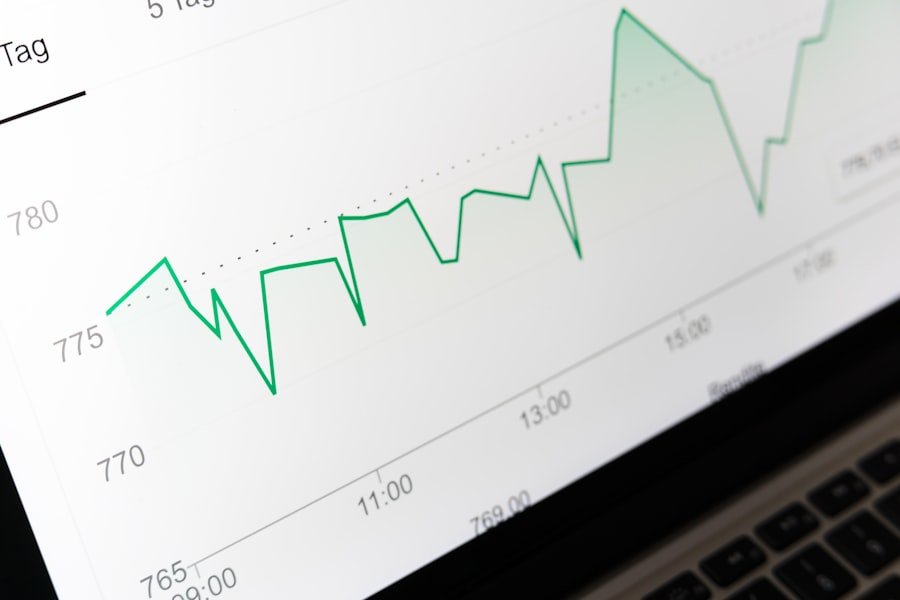
The insights gleaned from data analytics are invaluable for refining our sales processes and workflows. This is where analytical findings translate directly into operational improvements, creating a more efficient and effective sales engine.
Streamlining the Sales Funnel
Each stage of our sales funnel is a bottleneck potential. Data helps us identify and alleviate these constrictions.
- Stage-Specific Conversion Rates: By analyzing conversion rates at each pipeline stage, we pinpoint where deals are getting stuck or dropping off. This allows us to focus our efforts on improving specific stages, such as lead qualification or proposal presentation.
- Sales Cycle Duration by Stage: Understanding how long deals typically spend in each stage helps us identify inefficiencies and set realistic expectations. Exceptionally long dwell times in certain stages may indicate process hurdles or a lack of resources.
- Content Effectiveness Analysis: We track which sales collateral and messaging are most effective at moving prospects through different stages of the funnel, enabling us to optimize our sales enablement resources.
Enhancing Lead Management
Effective lead management is the bedrock of a healthy sales pipeline. Data analytics empowers us to refine our approach to lead generation, qualification, and distribution.
- Lead Quality Assessment: Through analysis of lead source, demographics, and behavioral data, we can objectively assess the quality of incoming leads and distinguish between high-potential and lower-potential prospects.
- Automated Lead Scoring and Routing: We implement automated systems that score leads based on predefined criteria and route them to the most appropriate sales representatives, ensuring timely follow-up.
- Marketing-Sales Alignment: By sharing data on lead performance, we foster a tighter alignment between our marketing and sales teams, ensuring that marketing efforts generate leads that are truly sales-ready.
Optimizing Sales Engagement Strategies
Data provides clarity on the most effective ways our sales teams interact with prospects and customers.
- Channel Effectiveness: We analyze which communication channels (email, phone, social media, in-person meetings) yield the highest engagement and conversion rates for different customer segments.
- Message Personalization: By understanding customer preferences and past interactions, we can personalize our sales messaging, leading to more relevant and impactful engagements.
- Optimal Contact Frequency: Data helps us determine the ideal frequency and timing of sales outreach to maximize engagement without overwhelming prospects.
Performance Measurement and Coaching
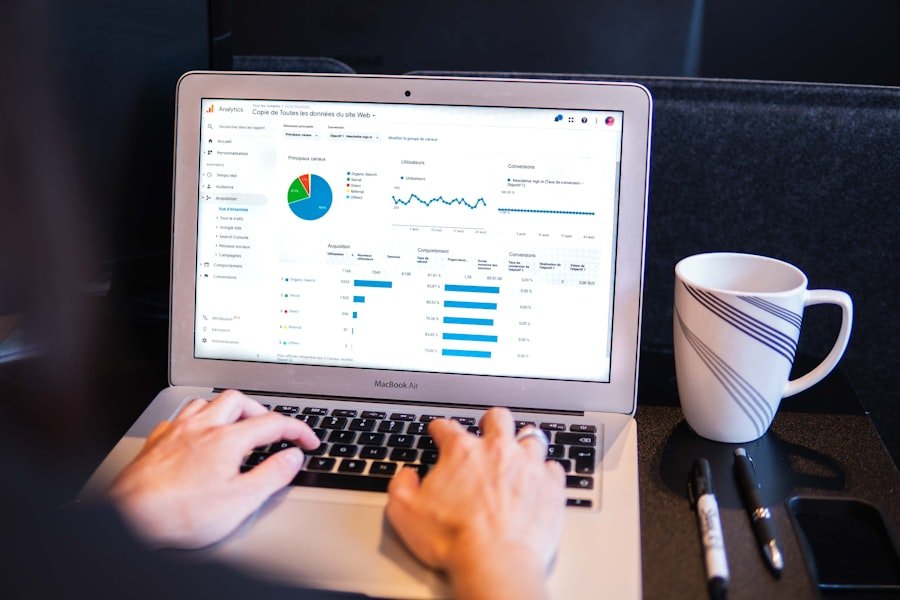
Our commitment to data-driven sales operations extends to individual and team performance measurement. This forms the basis for targeted coaching and continuous improvement, ensuring that every sales professional is equipped for success.
Individual Sales Representative Performance Evaluation
Beyond simple quota attainment, we delve into a nuanced understanding of each sales representative’s contribution.
- Activity vs. Outcome Correlation: We analyze the relationship between a representative’s activities (e.g., call volume, demo count) and their sales outcomes (e.g., win rate, average deal size). This helps identify if a rep is productive but not effective, or vice-versa.
- Skill Gap Identification: Discrepancies in performance metrics across reps can highlight specific skill gaps, such as negotiation expertise, product knowledge, or closing techniques.
- Pipeline Management Habits: We review individual pipeline hygiene, including opportunity updates, forecasting accuracy, and adherence to sales process stages. Poor pipeline management can skew forecasts and lead to missed opportunities.
Team-Level Performance Insights
Our analytical lens also focuses on the collective performance of sales teams, identifying synergistic strengths and systemic weaknesses.
- Team vs. Individual Benchmarking: We establish benchmarks for various performance metrics, allowing us to compare team performance against internal standards and individual reps against team averages.
- Inter-Team Collaboration Effectiveness: Data can reveal the impact of collaboration between sales teams or between sales and other departments on overall success metrics.
- Resource Utilization Analysis: We assess how effectively sales teams are utilizing available resources, such as sales enablement tools, training programs, and marketing collateral.
Coaching and Training Personalization
Data-driven insights empower us to move beyond generic training programs to highly personalized coaching approaches.
- Targeted Training Modules: Based on identified skill gaps, we recommend specific training courses or modules for individual representatives or teams, focusing on areas like objection handling, prospecting, or product-specific knowledge.
- Performance Improvement Plans (PIPs): For underperforming representatives, data provides the objective foundation for creating tailored PIPs with measurable goals and clear development pathways.
- Sharing Best Practices: We analyze successful sales patterns and behaviors of top performers, extracting actionable insights that can be disseminated as best practices across the entire sales organization. This helps elevate the collective capability.
To enhance the effectiveness of your sales team through data analytics, it can be beneficial to explore various perspectives on performance and growth. One insightful article that delves into the concept of overcoming challenges and learning from setbacks is available at What Does Failure Mean to You?. This piece emphasizes the importance of resilience and adaptability, qualities that can significantly impact a sales team’s ability to leverage data analytics for improved performance.
Continuous Improvement and Adaptive Strategies
| Metric | Description | How It Improves Sales Team Performance | Example Data Point |
|---|---|---|---|
| Lead Conversion Rate | Percentage of leads converted into customers | Identifies effectiveness of sales tactics and areas for training | 25% |
| Average Deal Size | Average revenue generated per closed deal | Helps focus on high-value opportunities and tailor sales strategies | 1500 units |
| Sales Cycle Length | Average time taken to close a deal | Highlights bottlenecks and opportunities to speed up sales process | 30 days |
| Activity Metrics (Calls, Emails) | Number of sales activities performed by reps | Measures effort and helps correlate activity with results | 50 calls/week |
| Quota Attainment | Percentage of sales reps meeting or exceeding targets | Assesses overall team performance and identifies top performers | 80% |
| Customer Retention Rate | Percentage of customers retained over a period | Indicates quality of sales and post-sale relationship management | 90% |
| Win Rate | Ratio of deals won to total deals pursued | Measures competitiveness and effectiveness of sales proposals | 35% |
| Sales Forecast Accuracy | Difference between forecasted and actual sales | Improves planning and resource allocation | 95% |
The sales landscape is dynamic, and our sales operations must be equally agile. Our approach to data analytics is not a static implementation but a continuous cycle of analysis, adaptation, and optimization. We view data as a living entity that consistently informs our strategic shifts.
Establishing Feedback Loops
A critical element of continuous improvement is the creation of robust feedback mechanisms that connect data insights back to our sales strategies and processes.
- Regular Performance Reviews: We conduct periodic reviews of sales performance data, both within sales operations and with sales leadership, to discuss trends, challenges, and opportunities.
- A/B Testing of Sales Approaches: We implement controlled experiments to test the effectiveness of different sales scripts, outreach methods, or pricing strategies, using data to determine optimal approaches.
- Cross-Functional Collaboration: We foster ongoing dialogue with marketing, product development, and customer success teams to ensure that our sales strategies are aligned with broader organizational goals and market realities.
Embracing Agile Methodologies
The principles of agile development, adapted for sales operations, allow us to iterate quickly and respond effectively to new data and changing market conditions.
- Short Iteration Cycles: We break down large strategic initiatives into smaller, manageable “sprints,” allowing for rapid testing of hypotheses and implementation of improvements.
- Adaptive Forecasting: Our sales forecasts are not rigid annual budgets but rather living documents that are continuously updated based on real-time performance data and market shifts.
- Flexibility in Process Design: We maintain a flexible mindset regarding our sales processes, being prepared to adjust or overhaul them based on evidence of inefficiency or ineffectiveness from our data analysis.
Leveraging Advanced Analytics and AI
As our data maturity evolves, we increasingly explore advanced analytical techniques and artificial intelligence (AI) to unlock deeper insights and automate decision-making.
- Machine Learning for Predictive Modeling: We utilize machine learning algorithms for more sophisticated lead scoring, churn prediction, and sales forecasting, moving beyond traditional statistical methods.
- Natural Language Processing (NLP) for Call Analysis: Applying NLP to sales call recordings or email exchanges can reveal sentiment, identify common objections, and highlight effective conversational tactics.
- AI-Powered Sales Enablement: AI tools can recommend personalized content to sales representatives, automate administrative tasks, and provide real-time coaching based on live sales interactions.
By rigorously applying data analytics within sales operations, we transform our sales teams from reactive sellers into proactive strategic assets. We empower our sales professionals with insights, refine our processes for maximum efficiency, and adapt our strategies to the ever-evolving market. This data-driven ethos is not merely about achieving sales targets; it is about building a resilient, intelligent, and continuously optimizing sales organization.
FAQs
What is data analytics in the context of sales operations?
Data analytics in sales operations involves collecting, processing, and analyzing sales-related data to gain insights that help improve sales strategies, team performance, and overall revenue.
How can data analytics improve sales team performance?
Data analytics can identify patterns in sales activities, highlight strengths and weaknesses of individual team members, forecast sales trends, optimize resource allocation, and enable data-driven decision-making to enhance overall team effectiveness.
What types of data are typically analyzed to improve sales performance?
Common data types include sales volume, conversion rates, customer demographics, lead sources, sales cycle length, individual sales rep performance metrics, and customer feedback.
What tools are commonly used for data analytics in sales operations?
Popular tools include CRM software with analytics capabilities (like Salesforce or HubSpot), business intelligence platforms (such as Tableau or Power BI), and specialized sales analytics tools that integrate with existing sales systems.
How often should sales data be analyzed to improve team performance?
Sales data should be analyzed regularly—ranging from daily or weekly for operational adjustments to monthly or quarterly for strategic planning—to ensure timely insights and continuous improvement.
Can data analytics help in setting sales targets?
Yes, data analytics can provide historical performance insights and market trends that help set realistic and achievable sales targets tailored to individual reps or teams.
Is training required for sales teams to use data analytics effectively?
While sales teams may not need to perform complex analyses themselves, training on interpreting data reports and using analytics tools can enhance their ability to leverage insights for improved performance.
What challenges might organizations face when implementing data analytics in sales operations?
Challenges include data quality issues, integration of disparate data sources, resistance to change among sales staff, lack of analytics expertise, and ensuring data privacy and security.
How does data analytics support sales forecasting?
Data analytics uses historical sales data, market trends, and predictive modeling to generate accurate sales forecasts, helping organizations plan inventory, staffing, and marketing efforts effectively.
Can data analytics identify the best sales strategies for a team?
Yes, by analyzing past sales outcomes and customer interactions, data analytics can reveal which strategies yield the highest conversion rates and customer satisfaction, guiding future sales approaches.