Unlearning is just one of the challenges. The learner is both a customer and learner. He needs to be told what is right for him. But you can’t be too strict as he is also a customer. Discover more in this balancing act.
Have you observed a dramatic shift in attitudes in people once they graduate from their school into junior college. No more uniform. Freedom. Rebel attitude. A similar such shift is seen in people who come back to classroom after they start working. Some of these people are NOT used to “Just in Time- Just Enough” mode of up-skilling. Most of them have done their Graduations, PGs and other established degrees. Add to this a dynamic of paying their own fees. It’s a strange beast.
- Words:1128 (Skim friendly)
- Type: Post
- Video:0
- Slides: 0
- Topic: Humans Of EdTech
- TIME: 6 Minute
I had done a couple of studies. Let me establish them. It will help me present my thoughts more decisively.
Study #01 - CRM Data Analysis
This is a quantitative exercise regarding the data we have from our CRM.
Data under study over here is close to 304 users and close to 137 variables. There are some variables which had missing values. We did a whole bunch of cleaning. Missing value imputation, deep diving and more.
We had a 17 batches that were part of this study.
At a High Level
- 304 learners are under study, after outlier removal.
- 137 variables per user
- 70 out of 220 are from IT companies. (Rest are freshers or unemployed)
- 150 out of 300 are having IT as their highest qualification.
- 43% of classroom population consumes lead magnet (131/304)
- 57.1% people are of 0 – 2 years of experience (173/304)
- 36.18% are active programmers (110/304)
- 42.43% have only programmed in college (129/304)
- 74.67% people are Engineers (227/304)
- 75% people are male
- 53% people expect Job
- 87% people are from Mumbai (267/304)
Effectiveness of Lead Nurturing
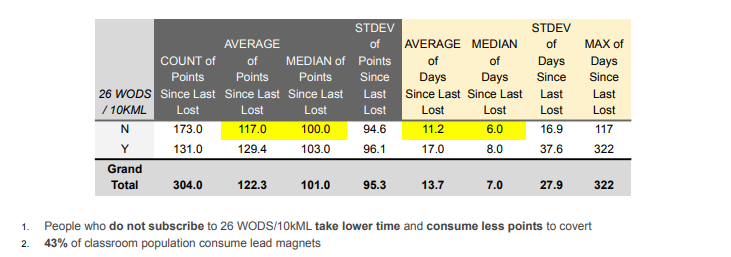
Lead magnet at that point in time, which we had active on our site, was “26 Weeks of Data Science” (26WoDS) or “The 10,000 Minute Lecture” (10kML). People who consume 26WoDS or 10kML take LONGER time and consume HIGHER points to convert. These points are generated basis lead scoring in LeadSquared.
Days Since Last Lost (DSLL) v/s Length of Sales Cycle
As per HubSpot – A ‘Sales Cycle’ is a set of specific actions salespeople follow to close a new customer. Sales cycles are often confused with sales methodologies — frameworks for implementing sales cycles. The sales cycle is more tactical, and often includes stages such as ‘prospect,’ ‘connect,’ ‘research,’ ‘present,’ and ‘close.’
Let’s define a Win Cycle – Win Cycle is a spurt of days when the lead is active on your site and across touch points like Download Brochures, Calling, Chat etc. to actually buying your product.
Conversely, a Lost Cycle is a spurt of days when the lead is active on your site and across touch points like Download Brochures, Calling, Chat etc. to abandoning the purchase of your product.
Days Since Last Lost – Leads go through multiple ‘lost cycles’ before they get enter ‘win cycle’. Everyone requires nurturing. As per my study – 89.18% leads go through over 1 lost cycles before entering a win cycle. Days since Last lost is actually the duration of the last cycle which is Win Cycle.
So people typically get into the CRM once and then they get active at multiple points in time, they do like a spurt of activity, then they kind of stop for some amount of time. And they once again get reactivated because they received some sort of stimulus from you. And they again kind of engaged with you. So that’s the magic of the marketing automation. If the person comes in your database and converts for you after like one and a half years, it doesn’t mean that one a half years is the sales cycle. Detecting spurt (momentum) in activity is the key.
Detecting spurt (momentum) in activity is the key.
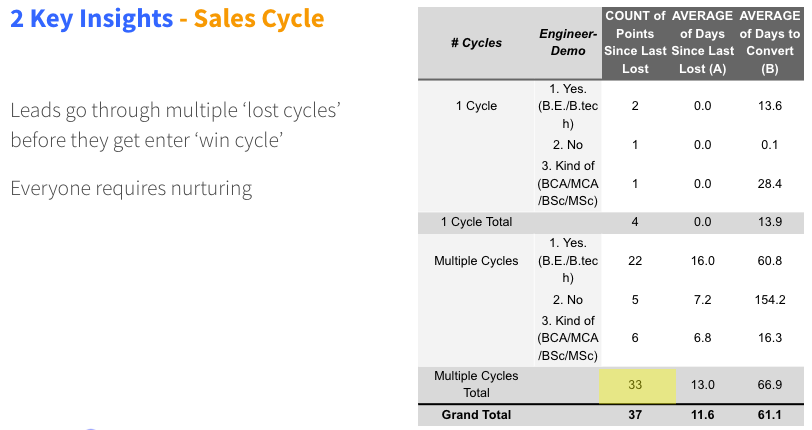
We broke our universe in 3 cohorts. I based these cohorts on admission dates of students. This will show whether the metrics are improving. So the same 304 learners, 99 122, and 83 are broken down into 3 mutually exclusive time buckets.
Experience Profile

- 64 out of 304 are Freshers (21.2 %)
- 109 out of 304 are 0 – 2 years of Experience (35.9 %) We can say that 57.1 % of total population is in range of 0 – 2 years of experience
People having 3 years or more experience take less time to convert and make less visits than others
Programming Background
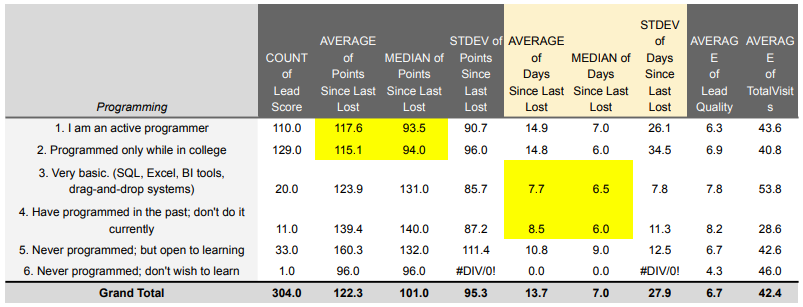
- 36.18% are Active Programmers, 42.43% have only Programmed in College
- 6.57% have done Very basic. (SQL, Excel, BI tools, drag-and-drop systems), 3.61% have programmed in the past; don’t do it currently
- 10.85% have Never programmed; but open to learning
Non Programmers take less time to convert
Education Background Mix

- 74.67 % are Engineers (227 out of 304)
Engineers take less points but more time to convert than others
Expectation from Program

- 53 % of population expects Job
Gender Mix

- 76 % of population are Male
No significant difference in Win Cycle duration between the two genders
Level of Awareness

- People who all are not at all familiar take much lesser time to convert
Maths and Statistics Aptitude

This data point was collected by our Tele Sales representative during counselling.
People who are Great, especially with quantitative elements converts faster
Insights - Middle of Funnel
- Days is needed to convert people.
- a. 13 Days (average)
- b. 7 days (median)
- Lead Score before kick-in.
- a. 116 Lead Score (Median)
- b. 132 Lead Score (Average)
- Post Telephonic – The web activity picks up
- On the website, activity is episodic –
- a. Prospects clock 30 points in a go
- b. Time duration of 15 minutes
- Post 13th Email of 26 Weeks of Data Science – Conversion Kicks in – Lead Magnet Consumption
Study #02 - Alumni Audit Survey
Persona where we could attract consistently as our customer base. I conducted this study only for the classroom business. This is good enough to give a statistically significant result. Sample Size – ~100
Maths and Statistics Aptitude
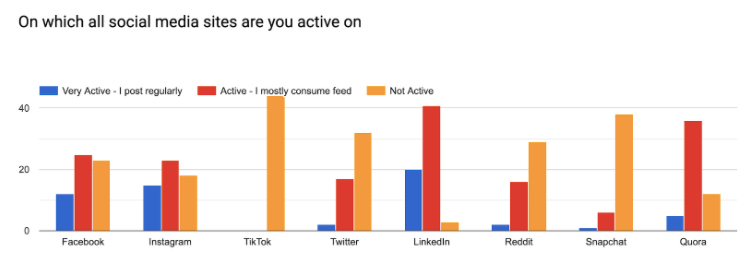
So let’s look at some social media sites where people were active on. So here, you can clearly see that people are very, very active on LinkedIn, regarding consuming the insights. Fence Sitters – People we will not post on those channels but actively consuming on those channels. So that is very much for Instagram and Facebook.
So Facebook and Instagram essentially are the channels where people go to, and they engage. LinkedIn and Quora are excellent platforms to target.
Order
- Quora
- Twitter / Reddit
Keep higher weight on Quora as a Lead Source
Marital Status
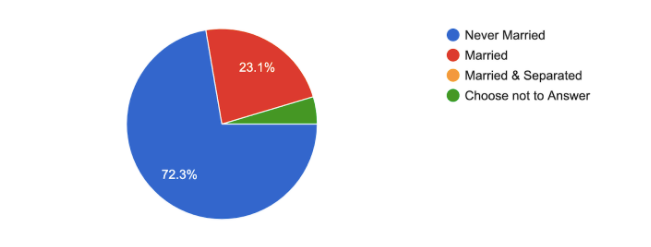
- 72.3% of the people are never-married people (bachelors)
- 23.1% are married
Bachelors who do not have any family commitments on the weekend to their family, or extended family are a ripe target segment. They can dedicate six months of their lives on the weekends only to do this kind of programme, the number shrinks once the person gets married. This can have significant implications regarding targeting and messaging for paid media.
Current Employment Status

75% of the people are working professionals. So people who are essentially having good day jobs five days a week they’re occupied. 25% are the ones who are scouting for jobs or who are just fresh out of college. Freshers account for 15%. So it was a very homogeneous audience.
Working Professionals convert fastest
Data Science Discovery
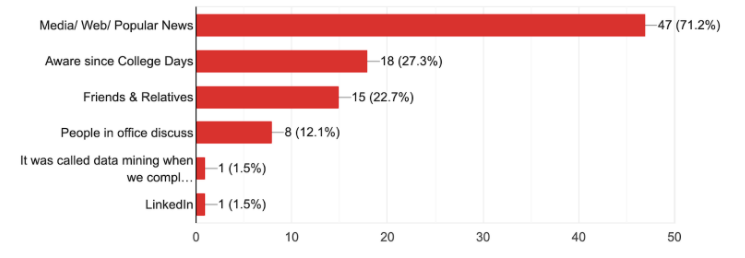
This is a very critical insight. Don’t spend time to educate people on what is Data Science.
Do brand campaigns. The Goal is arrive in the ‘consideration set’ once the person sets his/ her goal on doing data science.
Cut what is Data Science pitch. If people don’t know what Data Science is – you are pitching to wrong folks.
Don’t spend time to educate people on what is Data Science.
Internal Trigger for Career Change

“After I understood what data scientist does”, is the highest ranked followed by “After I realised I need to upskill”. So the two insights if we look at them together, what it typically ends up telling us that people who have understood what know the job prospects, career conscious ones, the people who want to act on time, be ready for the future. It also tells us that anything having simple lead magnets like ebooks, which will essentially help understand what careers in data science are all about, making them realise they need to upskill or listen to these things. So that’s where a lot of communication that you see on the media side, caters to the fear of missing out the FOMO part of it.
Some common themes - job prospects, career conscious ones, the people who want to act on time, be ready for the future.
Programming Knowledge
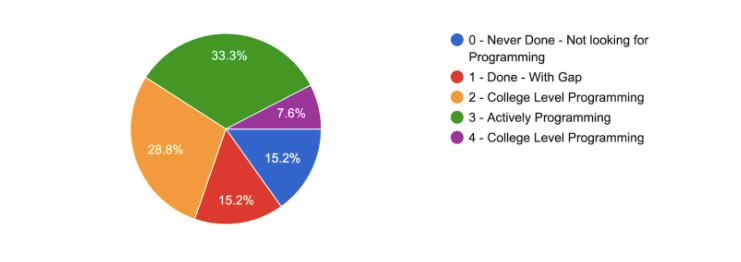
33.3% of the people are the ones who knew some amount of programming. 66% of the people, two-thirds of the people, have no foundation in programming. So this definitely has a lot of pointers for the delivery team regarding how they should design curriculum, and also what kind of targeting that you can bring in over here.
28.8%, which is college level programming, people who have done Electronics, Telecom CS-IT courses, maybe are more ripe targets for this kind of programme.
Preference for Mode of Delivery
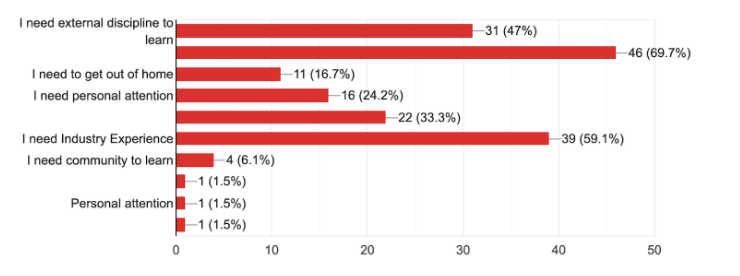
Top 3 reasons
- High quality Mentors
- Industry Experience
- Externally imposed Discipline
I think the key thing over here is that the “need for external discipline” and the “need for mentor” really stands over everything, and just really want some amount of “experience”.They can travel to one place, sit over there for the whole weekend, and make things happen.
Decision Cycle Time

Once the person is in the mode to decide – it is between 14 to 21 days, in a couple of weeks, a person can take a decision. 86% of the people are basically in the less than month bracket. There is a latching that happens where people come in the decision mode, and then they’re able to take this kind of decision prior to which they’re typically just in the evaluation mode. And a lot of this evaluation typically happens passively. The active evaluation happens once they are in decision mode.
86% of the people are basically in the less than month bracket.
Detailed Evaluation

56.7% people claim that they have read the all the details. So people read brochures. And second is referrals, read nothing, they follow their friends.
People read brochures.Referrals don’t evaluate.
Global Mentor
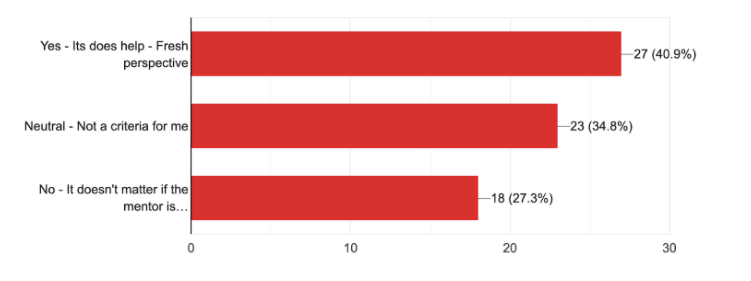
Having Global mentors does not drive any significant value.
Photo by Julia M Cameron from Pexels
Join to get sneak peek into what's happening
I write about books, experiences, product, UX, EdTech, early stage growth, validation – mostly tech. Subscribe if these topics interest you. Once every 15 days emailer. I promise – No spam. (I am known for it otherwise) 😉
