
Mathematically modelling is an iterative process. We start with the basics and gradually embellish the model to factor more of the reality.
This blog post proposed a way how product people can build features that are powered by AI. Just like any new technology it looks like magic. But at the core is some simple maths, deep consumer insight and some machine learning.
- Words:2209 (Skim friendly)
- Type: Post
- Video:0
- Slides: 0
- Topic: Humans Of EdTech
- TIME: 6 Minute
Content marketing is tricky. You publish a blog post and you want to see what kind of impact that this blog post has generated. Typically, a click through rate impressions-to-clicks ratio, and having an attribution regarding ‘whether this person ended up converting or buying a product or free trial?’
Some of these things are better quantified with multi touch attribution methods. What we have attempted in 2016, specifically with the content recommendation system essentially was – “Can we quantify the impact of the content?”.
Second, ‘Can we have a recommender in place, which will tell you what content to build, how to build, where to build, when to publish? Making the value chain increasingly predictive. So, over there, the entire thought process was that we want to quantify phenomena. Which at this point in time observed in the actual world.
The thought process was that we need to build a mathematical model, once we reached a point, and once we built out the first rudimentary mathematical model, that’s when we discovered that this mathematical model now needs to be calibrated, tuned, regressed, and it needs to improve, it needs to evolve. And the inputs are essentially fluctuating. And there are multiple data points over there. That’s when we felt that we can model some of these things using certain machine learning techniques. So the prediction or the classification that we wanted to do over there typically came down to the mathematical model that was based on it. And the mathematical model is based on phenomenon that was happening in the actual world. We need to better control to have a better traction, need to have a better understanding of it.
It was never that I want to build a machine learning model, because always I need better control, I need more bang for my buck, I need to save my money. Hence, solving the problem.

9Content, and the high level components that it needed to have regarding the various stages and the sub products. There is a pre-process, discover, promote, promotions, impact and otherwise. So in the preprocess, we need to define the analysis universe, we need to design all the lag indicators, and basically do the pre-processing. This is essentially going to be some sort of time series modelling. So having all autoregressive components in place. Then putting together a segmentation plan, where you need to build out models on smaller subsets of the universe where there is homogeneity within those clusters, and be able to, you know, build it out over there.
You need everything under some meaningful human interpretable scale. So normalisation was necessary. There is this team extraction, which is the LDA. Latent Dirichlet Allocation (LDA) is a NLP model. In which, with you’re able to identify the theme. After team extraction, then there is template extraction. We are using Analytical Hierarchy Process (AHP). We use AHP, when you have multi criteria decision-making process.
Which car you want to buy? In this, you can apply AHP. You can put your weights against the factors and come up with something very meaningful. So, this is something that we were thinking from a rule based engine. So that is the starting part of it.


Further Reading:
Step by Step Guide to building AI First Product Features
There isn’t really a recipe for building a AI first product. This blog post proposed a way how product people can build features that are powered by AI.
Then the promotions. Quantifying the impact as a base (habit), immediate impact, the carryover that happens in the future. You’re able to break it down into different parameters, where you’re able to have the alpha. Alpha is the impact on the last three or six months, depending on what is the habit formation. Beta is the immediate impact. The ‘Base’ which has been there, because of the long-term promotions that have happened for the brand, The carryover is something that is going to happen three months down the line, because what you did today, and if you’re able to break it all of this down, then I think with this, you will be able to draw the customer lifetime value, the cost, the ROI, what kind of what kind of impact you’re able to get, everything can be modelled because of this.
So, these are top level components.
Let’s look at the model parameters.
Now in the model parameters regarding content, what are the things the
- Readability Scores – So, there are multiple readability scores.
- Usability – what is the usability part of it the various funnel conversion metrics, the knowledge level
- Actionability – ease of sharing, virality, various consumer habits that we are looking at various variables features that can be selected over here.
The new revenue booked per month can be drastically different, depending on how some of these things are. So, that is just to visualise the impact of the customer lifetime value, and ticket size and lifespan and gross margin. So, these are basically some multiple CLV calculations that we have over here. Definitely something from David Skok and the team.

There has been some thought process or input in the ROI calculation, what kind of ROI? We have put together data regarding the content inventory. What do you have, and what status is in proposed, approved and processed ready to publish, what kind of money you’re spending on top of it, what kind of CTR it is going to get, and what kind of ROI it has?
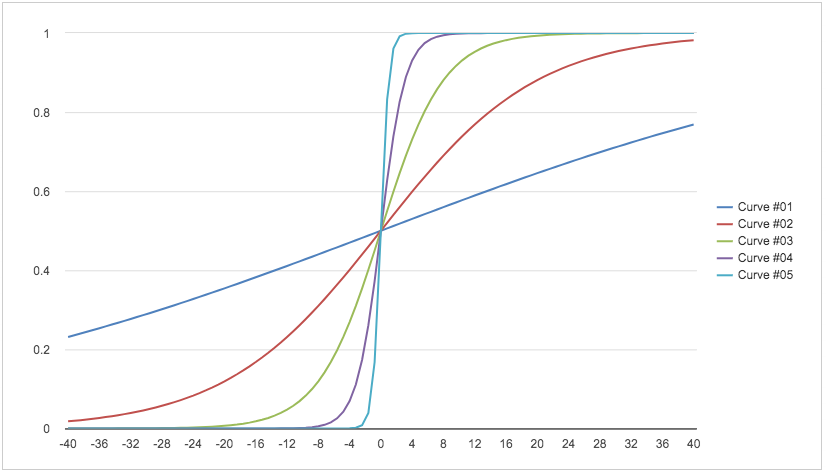
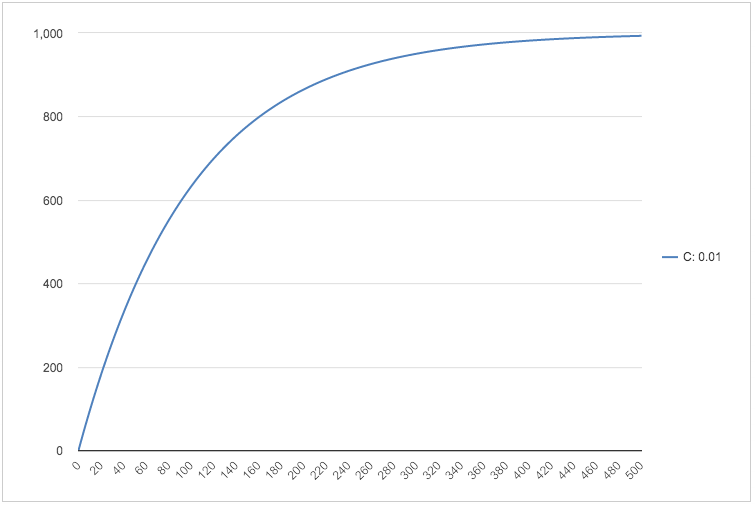
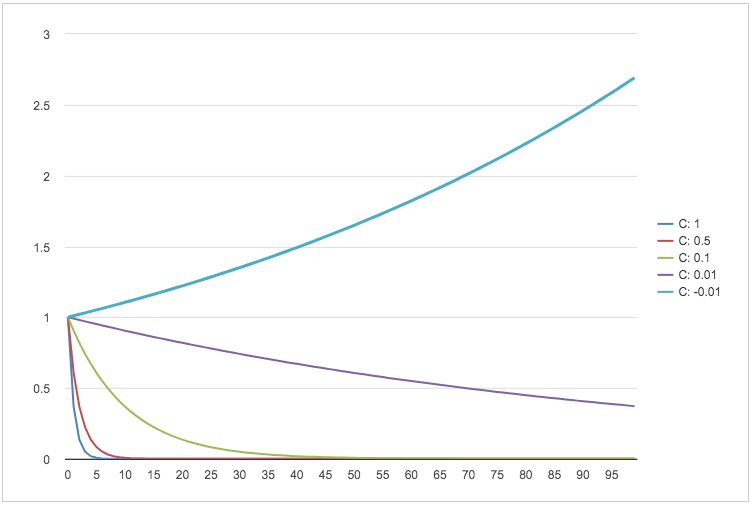
This is where the fun really begins, where we had just modelled the various curves. You want to have a law of diminishing returns, this is how it is done, you want to have all the autoregressive components modelled over here. This is how the autoregressive components are modelled over here. The decay is different in different cases. So you will see. So these are all the autoregressive components. This is just trying to unlock the underlying mathematics over here. This is how S Curve is drawn. So now you can see that there is a law of diminishing return, there is carryover, there is S curve. S-curve passing through the same point but drawn differently. So all the mathematics that goes behind that this particular point.
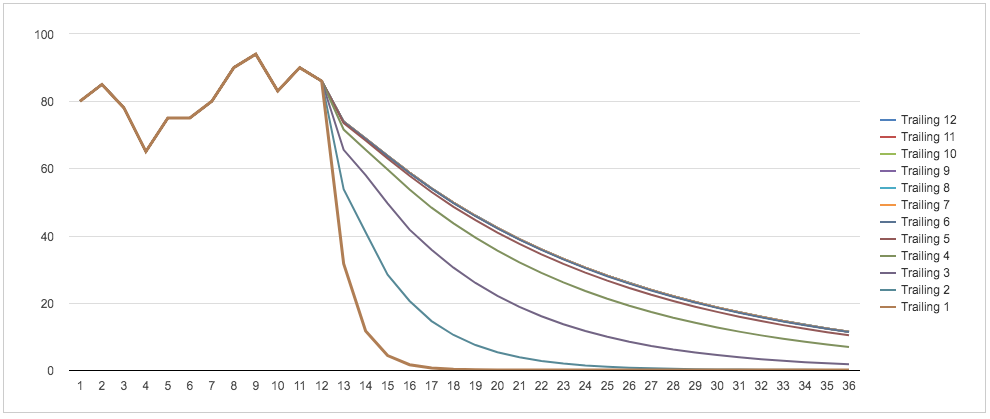
Carryover – The carryover is essentially things that you do right now, but the impact keeps on lingering. So if you see that the impact is for 24 months, and this is how that carrier is going to look like. And if we just visualise it, okay, you did few things, then the impact is going to carry over for 24 months, 24 weeks, 24 minutes, depending on whatever the thing is.
Convolution is when you multiply two signals, you essentially get convolution. And you just take in signal a and signal B and multiply that. This is just a simulation, just to see that you assemble the parts of it.
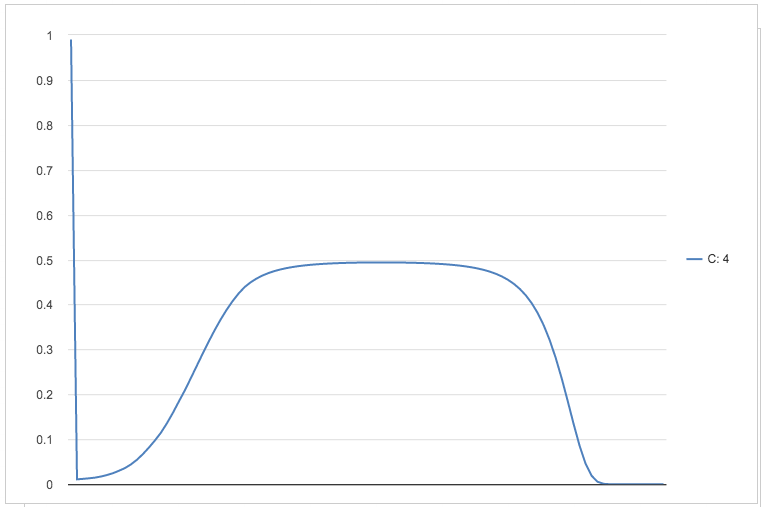
Finally, the decay function. So you have given promotions, so it is getting built up. When you stop giving promotions, you move from ‘promo’ to ‘no-promo’, it doesn’t mean that the whole chart collapses, it takes certain time and then it collapses. So this is how the base is. The decay essentially happens over here. So if you are at a particular point, and if you do different kind of stimulus and there is a strong decayed or D growth, and then there is some sort of a growth also depending on what kind of parameters are able to put over here regarding the C values and A value. So those are the kinds of things that we put over here.
What we’ve done over here is that the promotion – once you get a promotion, what can have a direct impact it has, what kind of carryover it has, what kind of a habit it has, what kind of base it has more than what is the total effect. And depending on the promotion, no promotion, we have like basically added all the math that we ever require in all the earlier Excel sheets and have just put all of them over here. And of course, there are the carryover assumptions and everything which were documented in a separate sheet, so on and so forth.
So this is what we call as a mathematical model of the phenomena, which is about quantifying the impact of a promotion. This quantifying the impact of this promotion, it will have its own set of assumptions. And those assumptions were very well documented. And we had put some sort of answers over here. So that is exactly what you will find over here.
My intent over here is not to offer your idea or anything of that sort. But it is like you know how idea can be modelled mathematically first. And then with the help of putting some of these basic high level structures together, this can then be then broken down into endpoints, this can be then broken down into services, this can be broken down into API’s.
And you can build out the whole microservices based architecture to actually enable something like this. So right from Genesis, where you have the seed of the idea, to be able to break it down mathematically, to be able to you know, and ultimately also have the view where you’re able to solve a business problem. So that’s the journey that I wanted to take you through on this particular video. Hopefully you found some value.
Photo by Lucas Fonseca from Pexels

Join to get sneak peek into what's happening
I write about books, experiences, product, UX, EdTech, early stage growth, validation – mostly tech. Subscribe if these topics interest you. Once every 15 days emailer. I promise – No spam. (I am known for it otherwise) 😉